This is mark Joseph “young” blog entry #143, on the subject of A Geographical Look at the Election.
For most of my life, I remember presidential races which ended sometime late on the night of Election Day when one of the candidates took the stage, conceded the election, and congratulated the opponent; then the other candidate took a different stage, thanked his supporters, said a few respectful words about his opponent, and started working toward his term in office. Politics was still something of a “gentleman’s game”, and the losers lost gracefully and the winners won graciously.
This time, the losers refuse to accept their loss. It is one of those elections–not for the first time–that majority of voters supported the losing candidate, and so there has been blame cast on the Electoral College system, and calls for recounts, and most recently suggestions that the Russians hacked the election process. With the Wisconsin recount actually increasing the margin by which Trump took the state, the Michigan recount discovering massive fraud in many of the precincts won by Clinton, and the courts blocking the vital Pennsylvania recount, they are getting desperate.
For myself, I am worried that the polarization of America is going to lead to some sort of civil war. I look not so much at the population but at the geography of the matter, and have reason to worry.
- In Alabama, Trump took fifty-four of sixty-seven counties–over eighty percent–leaving just thirteen for Clinton. Perhaps more significantly, he had over seventy-five percent of the vote in twenty-three of them–Clinton successfully doing so in only two. Of course, Alabama was a strong win for Trump overall, with 62.9% of the vote to Clinton’s 34.6%.
- Alaska was not so strong a victory for Trump, with only 52.9% of the vote, but a lot of voters went to third-party candidates there leaving Clinton a paltry 37.7%. The state apparently has only one county, so while the state is not massively for Trump, it does seem to be massively against Clinton.
- Arizona was a close one, with only 49.5% of the vote going to Trump and a strong 45.4% going to Clinton. Eleven of fifteen counties went to Trump there.
- Arkansas was another strong Trump win; of seventy-four counties, Clinton took only eight–under eleven percent–leaving sixty-six for Trump, along with 60.4% of the vote to her 33.8%. He also took more than seventy-five percent of the vote in nine counties–more counties than she took total–with her best about sixty-two percent in one county.
- California of course went strongly for Clinton, with 61.6% of the vote to Trump’s 32.8%. However, of fifty-eight counties, Trump actually took the majority of the votes in twenty-five–about forty-three percent, leaving thirty-three for Clinton.
- Colorado was a close win for Clinton, with 47.2% of the vote to Trump’s 44.4%. However, Trump had majorities in forty-one of sixty-four counties, almost two-thirds, leaving Clinton only twenty-three. Further, in eleven of those counties Trump took at least seventy-five percent of the vote, a feat Clinton only achieved in one of them.
- Connecticut was a bit better for Clinton–she took 54.5% of the vote to Trump’s 41.2%. She even took most of the small state geographically–six out of eight counties. She did not get as much sixty percent of the vote in any one of them, though.
- Delaware also went to Clinton, with 53.4% of the vote to Trump’s 41.9%. However, only one of the three counties went for Clinton, the other two supporting Trump, one of them very strongly.
- The District of Columbia is not a state and has no congressional representation, but it does get three electoral votes; 92.8% of its tiny population went for Clinton, 4.1% for Trump. Obviously it does not have counties, so like Alaska it is a single unit.
- Trump took a slight edge in Florida, with 49.1% to Clinton’s 47.8%; I’m surprised Jill Stein didn’t call for a recount there, but that might be a politically sensitive issue there. However, the geographical disproportionality is tremendous there: Of sixty-seven counties, Clinton took only nine–a little more than one eighth–leaving fifty-eight for Trump. Further, he took better than seventy-five percent in eleven counties, and she did not approach that level in any.
- Georgia was Trump, at 51.3% to Clinton’s 45.6%. Again, though, the geography is overwhelming: Clinton had thirty of one hundred fifty-nine counties, giving one hundred twenty-nine–over eighty percent–to Trump. In forty of those–a quarter of all the counties in the state–he took over seventy-five percent of the vote; Clinton reached that mark in only two counties.
- 62.3% of Hawaiian voters went for Clinton, and only 30.1% for Trump. Here Clinton had a strong showing, taking majorities in all four counties, all between sixty and sixty-five percent against Trump’s twenty-five to thirty-five percent.
- Idaho was 59.2% for Trump, 27.6% for Clinton, but it is even worse than that. Clinton only placed first in two of forty-four counties, and there were seven counties in which she placed third behind an independent candidate popular in the western states named Evan McMullin, coming out of the Republican party and thus reducing Trump’s support.
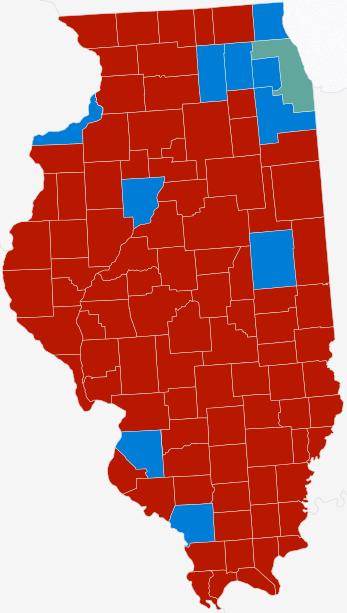
- Clinton took Illinois with 55.4% of the vote to Trump’s 39.4%, but the geography again is against her: of one hundred two counties, she took only eleven, giving ninety-one–almost ninety percent–to Trump. He took nineteen of those with better than seventy-five percent of the vote; Clinton’s best showing was just shy of that.
- Indiana went to Trump with 57.2% of the vote to Clinton’s 37.9%. On top of that, only four counties favored Clinton, the other eighty-eighty going to Trump, and her best showing was not quite sixty percent, while again Trump took more than three quarters of the vote in nine counties.
- Iowa has ninety-nine counties, of which ninety-three went to Trump, only six to Clinton. He took the state with 51.8% of the vote to her 42.2%. It was a more moderate victory–he took three quarters of the vote or more in only four counties.
- Trump not only took Kansas with 57.2% of the vote to Clinton’s 36.2%, he took one hundred two of its one hundred four counties, fifty-three of them–more than half–by at least three quarters of the vote.
- Kentucky has one hundred twenty counties, and Clinton took the majority of votes in two. She did take 42.7% of the total vote, losing to Trump’s 62.7%; he took more than three-quarters of the vote in fifty-seven counties.
- Trump had another strong win in Louisiana, with 58.1% of the vote to Clinton’s 38.4%. Louisiana doesn’t actually have “counties” because it calls them “parishes”, a throwback to the fact that it was originally organized as a French territory, but they serve the same function, and Trump took fifty-four of sixty-four, leaving ten for Clinton. He took thirteen of those with seventy-five percent or more of the vote; Clinton took one of hers at that margin.
- Maine is one of the two states that apportions its electoral votes according to the percent of voters, and so Clinton’s 47.9% of the vote got her three of those votes, Trump’s 45.2% garnishing him the remaining one. Although the map looks a lot “redder” than “blue”, it’s because the seven coastal counties Clinton took are a lot smaller, geographically, than the nine much larger inland counties that when to Trump. All of these were close.
- Maryland strongly favored Clinton, with 60.5% of the vote going to her, 35.3% to Trump. The map, though, shows that Clinton’s support was localized to the suburbs of Baltimore and of Washington, D. C.–she took six of twenty-three counties plus Baltimore City (counted separately from Baltimore County, which she also took), leaving seventy percent of the counties for Trump. She had strong victories in two of her counties, taking at least three quarters of the vote, but he did as well in one of his.
- Massachusetts is entirely blue–Clinton took every one of fourteen counties. She got three quarters of the vote in one of them, and state-wide took 60.8% to Trump’s 33.5%.
- As we noted, the recount in Michigan has uncovered massive voter fraud in many districts taken by the Democrats. However, the numbers before the recount gave Trump 47.6% of the vote to Clinton’s 47.3%, and despite the claim that it is supposed to be a “blue” state, the map is mostly red–seventy-five of eighty-three counties went to Trump, leaving Clinton with eight.
- Clinton squeaked out a victory in Minnesota, with 46.9% of the vote to Trump’s 45.4%–but again the blue state looks very red. Of eighty-seven counties, only nine went to Clinton, seventy-eight to Trump.
- The geography is not quite so lopsided in Mississippi, where Clinton took twenty-four of eighty-two counties, not quite a third, four of them with better than three quarters of the vote; but Trump took the other fifty-eight counties, seventeen of them with at least three quarters of the vote, and took the state with 58.3% to her 39.7%.
- Show me Missouri, and I see a solid Trump win with 57.1% of the vote to Clinton’s 38.0%. Geographically I see an even stronger showing, as Trump took majorities in one hundred twelve of one hundred fifteen counties, leaving Clinton to claim only three, plus St. Louis City (counted separately from St. Louis County, which she also took). Trump took at least three quarters of the vote in sixty-six of those counties, more than half; Clinton did so well only in St. Louis City itself.
- Montana also went to Trump, 56.5% to 36.0%, and again even more dramatically looked at geographically. Clinton took only five of fifty-five counties, about nine percent against Trump’s ninety-one percent, fifty counties. He took eighteen of those by at least seventy-five percent of the vote, one of them by over ninety percent. In two of the five Clinton won she actually took less than fifty percent of the vote, but beat Trump due to strong showings by Libertarian candidate Gary Johnson.
- In Nebraska, Clinton took majorities in only two of ninety-three counties, and in both she had less than fifty percent of the vote, Libertarian Gary Johnson making a strong showing. She took only 34% of the vote to Trump’s 60.3%, and he sixty-three counties by at least seventy-five percent of the vote, four of them by over ninety percent.
- Clinton took Nevada, 47.9% to 45.5%, but she only took two of the seventeen counties in Nevada, the other fifteen going to Trump–and she didn’t actually have a majority of the voters in one of the counties she took, while Trump had at least three quarters of the votes in four of his counties.
Are you noticing a pattern here?
- Our “new” states start, alphabetically, with New Hampshire, where Clinton took 47.6% to Trump’s 47.2%. Although it is a lot closer, again geographically Trump is favored, taking six of ten counties. All of them were close.
- New Jersey was 55.0% for Clinton, 41.8% for Trump, and for once she got the slim majority of counties–twelve of twenty-one, leaving nine for Trump. Most counties were close; in none did either candidate take three quarters of the vote.
- In New Mexico, the vote went for Clinton, 48.3% to 40.0%, but the geography slightly favored Trump. He took the majority in nineteen counties, Clinton in fourteen.
- New York, where Clinton was once Senator, went for her by 58.8% to 37.5% for Trump, who considers it his home state. Still, of sixty-two counties, Clinton took majorities in only sixteen, leaving Trump forty-six counties, less than one percent shy of three quarters of them. She took three quarters of the vote in four of those counties, all of them containing parts of New York City.
- By the population, Trump edged out Clinton in North Carolina with 50.5% of the vote to her 46.7%. She did better here geographically, taking twenty-four of the one hundred counties, not quite a quarter. Trump took at least three-quarters of the vote in nine counties; Clinton did so in only one.
- Further north we have North Dakota, which Trump took with 64.1% of the vote to Clinton’s 27.8%. Trump also took all but two of fifty-three counties, twenty-one of them with at least three quarters of the vote.
- In Ohio, Clinton took only seven of eighty-eight counties, and 43.5% of the vote against Trump’s 52.1%. In a dozen of his eighty-one counties Trump took at least three-quarters of the vote.
- Where the wind comes whistling down the plane in Olklahoma, it blew solidly to Trump, with 65.3% of the vote to Clinton’s 28.9, and every one of seventy-eight counties, and in more than half–forty-three of them–he took more than three quarters of the vote.
- Clinton took Oregon, 51.7% to 41.1%, but again the map is mostly red–she took eight of thirty-six counties, two ninths, less than a quarter. Clinton took at least three-quarters of the vote in one county, Trump in three.
- Pennsylvania looks very close by the numbers, with Trump’s 48.8% squeaking past Clinton’s 47.6%, and a court ruling preventing a recount, but again geographically it does not look close at all. Of sixty-seven counties, Clinton took only eleven, leaving fifty-six for Trump. Clinton took one of those counties by better than three-quarters of the vote; Trump did so in seven.
- Rhode Island, the smallest state geographically, where Clinton won with 55.4% of the vote to Trump’s 39.8, has only five counties; Trump took only one.
- The geography is also better for Clinton in South Carolina, although still there she took only fifteen of forty-six counties, and only 40.8% of the vote to Trump’s 54.9%. Clinton took better than seventy-five percent of the vote in one county.
- Not so far south in South Dakota, sixty-one of sixty-six counties went to Trump, five to Clinton, as he took the state with 61.5% of the vote to her 31.7%. He took sixteen of those counties with three quarters or more of the vote–more than three times as many at that rate than she took at all, although she did take three quarters of the vote in one of her counties–and one of his he took by better than nine out of ten votes cast.
- Three of Tennessee’s ninety-five counties did not go to Trump, who took 61.1% of the vote in that state to Clinton’s 34.9%. He took forty-eight of those by at least seventy-five percent of the vote.
- It sounds good to say that in the next state Clinton took the majority in twenty-five counties, and with at least three-quarters of the vote in three of them–until you say that the state is Texas, and of its two hundred fifty-four counties that’s slightly less than ten percent, leaving two hundred twenty-nine for Trummp. He took one hundred thirty-eight of those with at least seventy-five percent of the vote, eight of them with at least ninety percent. He took the state with 52.6% of the vote to her 43.4%.
- To say that Clinton placed first in only three of Utah’s twenty-nine counties is to understate how poorly she did there. In only one of those three did she get more than half the votes, and that barely, and in fourteen of the twenty-six Trump won she placed third, behind that previously mentioned independent candidate popular in the western states, Evan McMullin, who also did well in Idaho, and who also tied her in a fifteenth second-place position here. Despite this three-way race, Trump took five counties by at least seventy-five percent of the vote, and took 45.9% of the total against her 27.8%.
- Clinton did manage very nearly to sweep the small state of Vermont, taking 61.1% of the vote to Trump’s 32.6% and holding a majority in all but one of its fourteen counties.
- She also took 49.9% of the vote in Virginia, where Trump got 45.0%. Virginia counts most of its cities separately from the counties in which they are situated. She took twelve of the ninety-four counties and twenty-eight of the thirty-nine cities–generally small blue dots on a largely red map. That’s ninety-three voting districts going to Trump, forty to Clinton, and he took sixteen of his counties by at least three-quarters of the votes, which she accomplished in five of her cities.
- In Washington, they stopped counting after just over ninety percent of the precincts had reported; only seven of the thirty-eight counties were complete, of which Trump took six. If we include all the counties, unfinished, Clinton took about twelve, Trump about twenty-six. (One county, counted as for Clinton, is close enough that the uncounted votes may be about sixty times as many as the difference between Clinton and Trump there, so it is being generous to say she took that county.) Of the votes counted, 54.4% went to Clinton, 38.2% to Trump, so although almost nine percent of the state remains unreported, it would not be sufficient to reverse the state outcome–only the national total.
- West Virginia went strongly for Trump, 68.7% to Clinton’s 26.5%. It is not surprising that he took majorities in every one of its fifty-five counties, twenty-two of them with at least three-quarters of the vote.
- The recount in Wisconsin, as mentioned, reportedly found a few more votes for Trump; the originally reported totals gave him 47.9% against Clinton’s 46.9%. Clinton’s strength gives her only thirteen of the state’s seventy-two counties, fifty-nine going to Trump. She did take better than three-quarters of the vote in one of the counties on her list.
- The last state on an alphabetical list, Wyoming, is also the one in which Trump had the best showing at 70.1% to Clinton’s 22.5%. He did not take every one of the twenty-three counties–only twenty-two, leaving one for Clinton. He did take fifteen of them with at least three-fourths of the votes.
So what’s the point of all this? If you did the math (of course you didn’t, that’s my job), you noticed that if we count by reporting counties/cities, Trump took two thousand six hundred twenty eight, to Clinton’s four hundred eighty-three–84% of all the places in the country where voting was counted. You might also note that if we average the percentage of votes each took in each state, Trump took 48.97% to Clinton’s 45.24%–that is, a greater percentage of people counted state by state preferred Trump. He clearly is favored geographically.
So who cares? Why should it matter if more places want Trump to be President, if we live in a democracy, and more people want Clinton?
And that is exactly what the Democratic party wants you to think: all those people in all those places which are mostly outside the cities don’t matter and should not really be considered in how we, the urbane people from the urban centers, want to run the country.
They are actually counting on this for the future of their party: the demographics say that people who live in these high-population-density areas tend to vote Democratic, and they are increasing in numbers faster than those in the more sparsely populated Republican areas, and so using the fact that we are a democracy they can bully the outnumbered rural and light suburban people into their plans. As one of my rural friends commented, “How rude”.
But the fact is that we are not a democracy. We are a federated republic–and the difference is important. This is not you, me, and some maybe one hundred fifty million other voters deciding how to run our country. We are not, first and foremost, a union of individuals, but a union of states, of political entities comprised of individuals. This is about New Jersey and Utah, California and Colorado, Florida and New York, about three thousand counties in fifty states and one political district, coming together to agree as to how they, as separate political entities, will govern themselves collectively. It says, inherently, that the people in the boondocks will be heard, will have a say in how they are governed.
Yet the people who want to cancel the Trump victory want to disenfranchise these people in the name of “democracy”. These are the same people who complain that the country has tried to disenfranchise blacks, women, and other minorities. Their entire political strategy is based on disenfranchising those with whom they disagree–despite the fact that these are the people who, in the main, provide our corn and our beef, our potatoes and our milk, our national petroleum, even to a large degree our fresh water. Do you really want to tell these people that you don’t care about them, that they should not have a say in how their country is run?
The rural people won this time; they’ve lost a few over the past decade, and that’s the way the system works, passing the lead back and forth between the progressives and the reactionaries for a while, eventually (usually) settling to a middle ground which is more progressive than we were and not as progressive as the radicals wanted us to be. But if you take this victory away from them, it’s going to hurt in ways that are likely to come back–not, perhaps, a civil war, but certainly a change in the way the producers of our necessities regard the massed consumers who are living in the urban areas and pretending that the people on whom their lives depend are inconsequential.
I don’t think that it will happen, that Trump’s victory will be overturned, but I thought all of those calling for it should give some consideration to what they are really saying.
The statistics in this article were compiled by hand from Politico; I apologize if there are any mistakes.
[contact-form subject='[mark Joseph %26quot;young%26quot;’][contact-field label=’Name’ type=’name’ required=’1’/][contact-field label=’Email’ type=’email’ required=’1’/][contact-field label=’Website’ type=’url’/][contact-field label=’Comment: Note that this form will contact the author by e-mail; to post comments to the article, see below.’ type=’textarea’ required=’1’/][/contact-form]